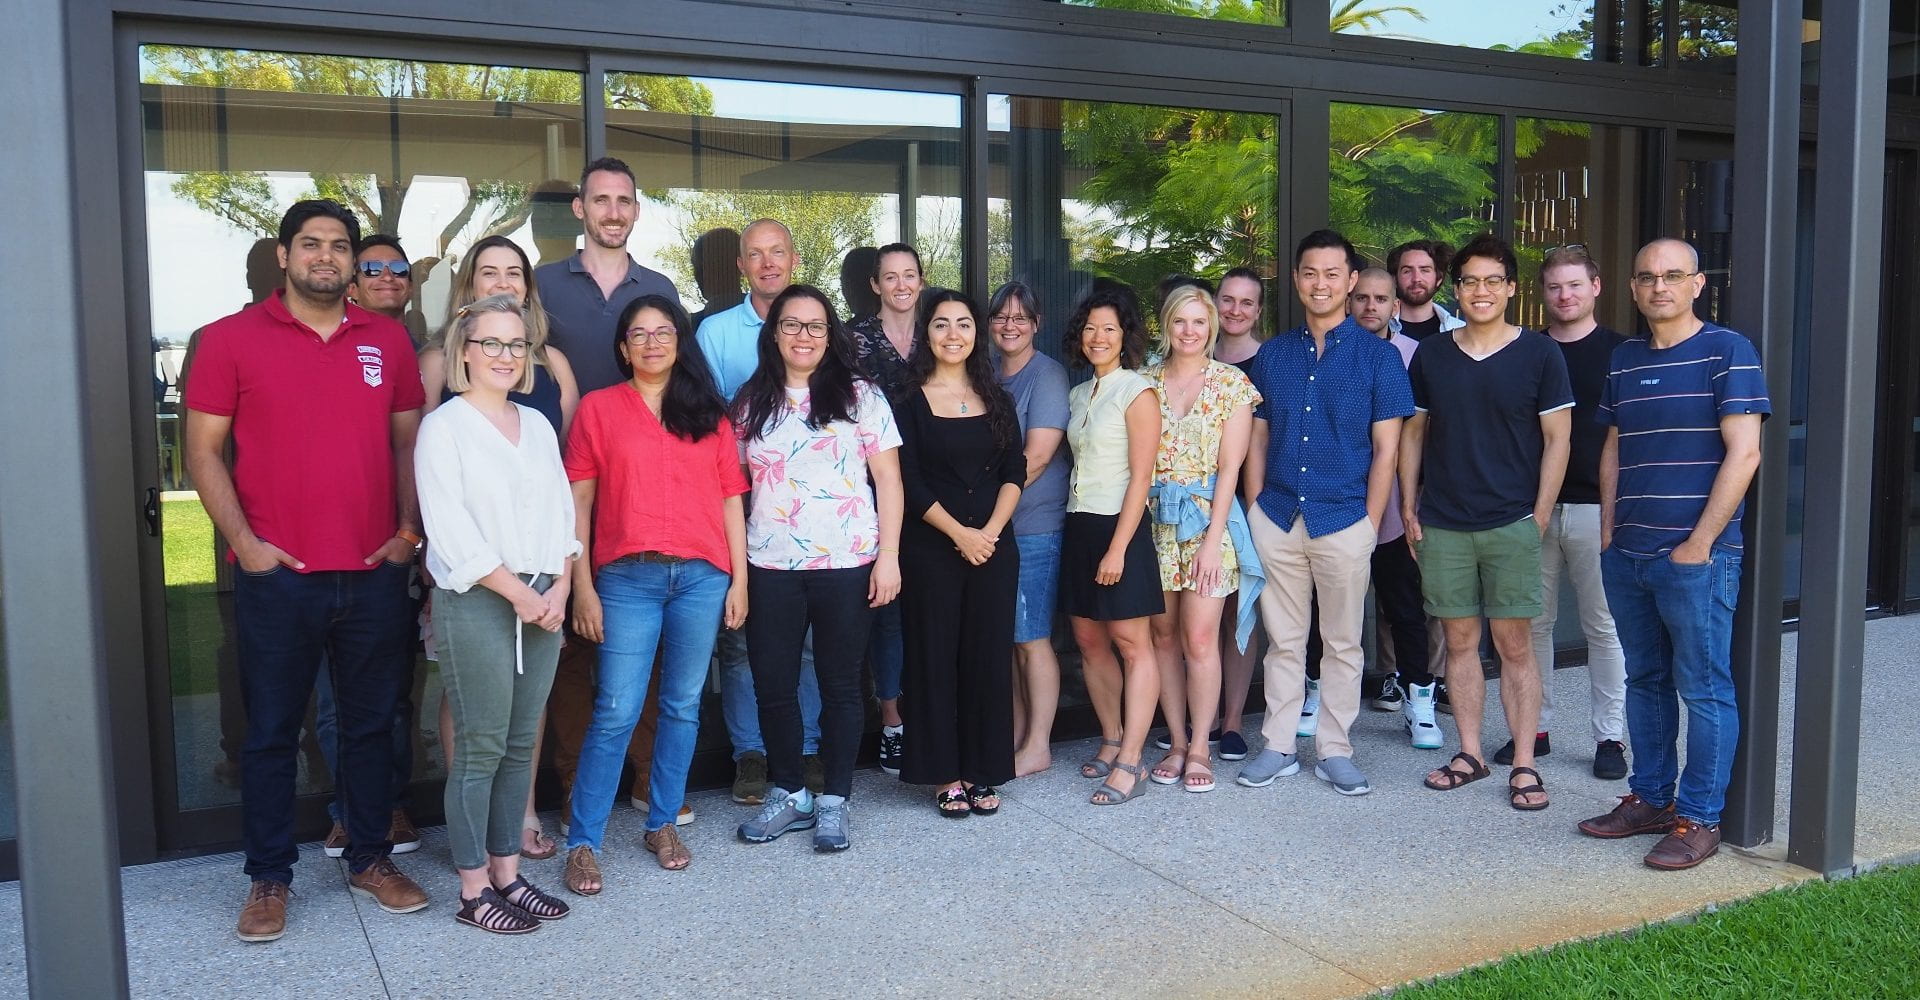
mixOmics workshop UWA 3-5 Feb
We ran a beginner workshop in sunny Perth to 20 participants from the Universities and CSIRO from Western Australia. We also have participants from Canberra, New Zealand, Singapore. We were ere hosted in the beautiful Forrest Hall facility from the Forrest Research Foundation.
The workshop introduced concepts of multivariate dimension methods developed in mixOmics for statistical analysis. We covered unsupervised (exploratory), supervised (classification) and integration analyses and introduced our various analytical frameworks for data exploration, selection of markers, integration with other omics datasets and introduction to time-course analysis. Each methodology was illustrated on real biological studies hands-on. The third day was ‘BYO data’ day where participants could reinforce their learnings on their own study.
This is the second edition of a microbiome-focus mixomics workshop that we ran last year at UoM, more details can be found on our mixOmics webpage.
Some feedback from the participants:
‘I liked you took some time to explain the concept behind the statistical tool, useful examples to clarify the concepts. After this workshop, it is going to be much easier to make better decisions about future experimental designs (or recommendations for other experiments) and the application of specific statistical tool as MixOmics. I will definitely apply mixMC to the data I am preparing for a publication. I appreciate you granted me the bursary. This workshop has uplifted my microbiome-applied statistical skills.’
‘This was a great workshop and it exceed my expectations’
‘I could complete all the exercises based on the material provided (which was great, with very clear instructions!). Most importantly, I acquired a better understanding of how I should approach my data in the future when my new project is in a more advanced stage. In other words, I now have a better idea of the packages and tools available and what to focus on in terms of skills development. I am also feeling a lot more confident to interpret complex plots generated in these multivariate analyses and make further decisions based on them and my research question’.