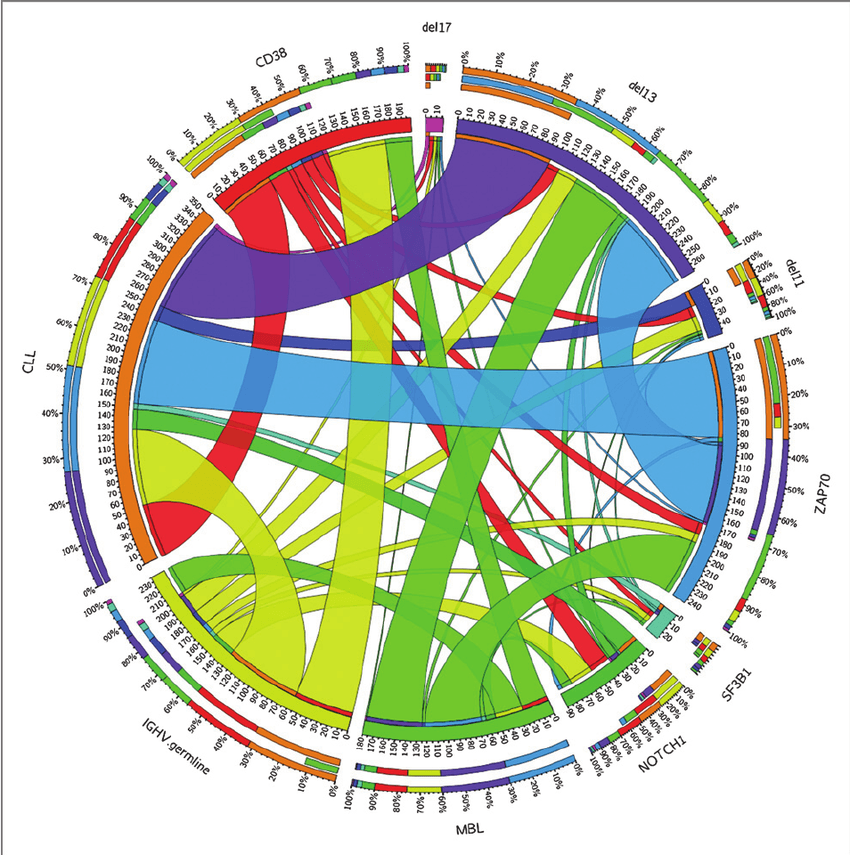
Masterclass, School of Mathematics and Statistics, Oct 10, 12-1pm (Evan Williams) , UoM
‘Introduction to visualization for small and big data’ by Kim-Anh Le Cao, School of Mathematics and Statistics, Oct 10 12-1pm (Evan Williams), University of Melbourne, Melbourne, Australia.
‘A picture is worth a thousand words’. Graphical displays are powerful ways of conveying a message or a story about the data we wish to explore or analyse. In this masterclass, I will give some practical tips of how to produce good graphics. I will also introduce some different strategies and methods to represent big data. I will illustrate these graphics on big biological data we routinely analyse in my group.